Data Analysis − Math and Reading Skills
Data analysis questions are included on many teacher certification state licensing tests, as well as on various English as a second language examinations.
If you are taking a basic skills test in order to get your state teaching certificate, you may see data analysis questions on both the math and the reading sections of your exam.
That is because understanding data representation requires skills in both reading and math.
You need to be able to read the legend or key in order to understand which groups or data sets are represented on the illustration or diagram.
You will also need math skills in order to answer the questions on data analysis.
For instance, the graph may show subsets of a group, and you will have to add the amounts from each of the subsets together to get the total for the group.
Why is Data Analysis Included on the Test?
Data analysis is included on these exams because chart, graphs, and tables test your understanding of the representation of information in a visual format.
The administrators of standardized exams are former educators, and as such, they know that students have different styles of learning and comprehension.
Some students will understand information best when it is in textual, narrative form.
Other students will comprehend information better when it is represented in a visual format.
So, you will need to know how to understand various types of charts, graphs, and tables for your exam.
Types of Data Analysis Illustrations
Data analysis questions on your exam will include visual representations such as charts, bar graphs, line graphs, or tables.
Pie charts
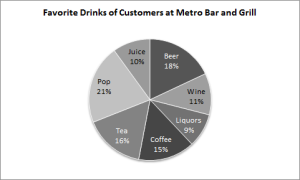
Pie charts are circular and contain segments for each group represented on the chart.
Data analysis questions on pie charts often involve the calculation of percentages.

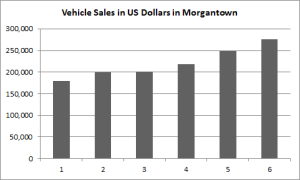
Bar charts show horizontal or vertical bars for the total of each group or subset.
The bars may be in color or in various shades of gray.

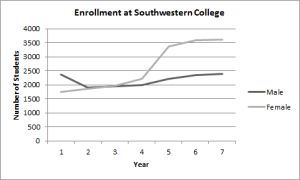
Line graphs are traditional graphs with an x axis and a y axis.
The graph shows various points, which are connected by a line.
The line will help you see where there have been increases or decreases.
Line graphs may have more than one line. In that case, you usually have to identify differences between the amounts from the two lines.

Tables are illustrations that show the data in rows and columns.
Be sure to read the column headings carefully when analyzing data in table format.
Types of Data Analysis Questions
The most common kind of data analysis question is the type that asks you to identify the years during which the greatest change has occurred.
You may need to calculate the numerical increase or decrease for a particular year.
There may also be questions on percentage increases or decreases from year to year.
In addition, you may need to categorize data into groups, calculate totals for each group, and then draw conclusions.
If you are taking an English as a second language exam such as IELTS, you will need to write a data analysis essay.
In your essay, you need to comment on the significant features of the data.